Tableau Certification Training Master Data Visualization, Analytics & Interactive Dashboards
Unlock the power of data with Insta InfoTech®’s Tableau Certification Training, a comprehensive program designed to help you master Data Visualization, Data Analytics, and Business Intelligence. This course covers everything from Tableau fundamentals to advanced techniques, including Interactive Dashboards, Data Blending, Calculated Fields, and Real-Time Reporting.
Through practical projects and real-world datasets, you will learn how to transform complex data into clear visual insights that support strategic decision-making. Whether you are a beginner or a professional looking to upgrade your analytics skills, this training prepares you for roles such as Data Analyst, Business Intelligence Developer, and Tableau Specialist.
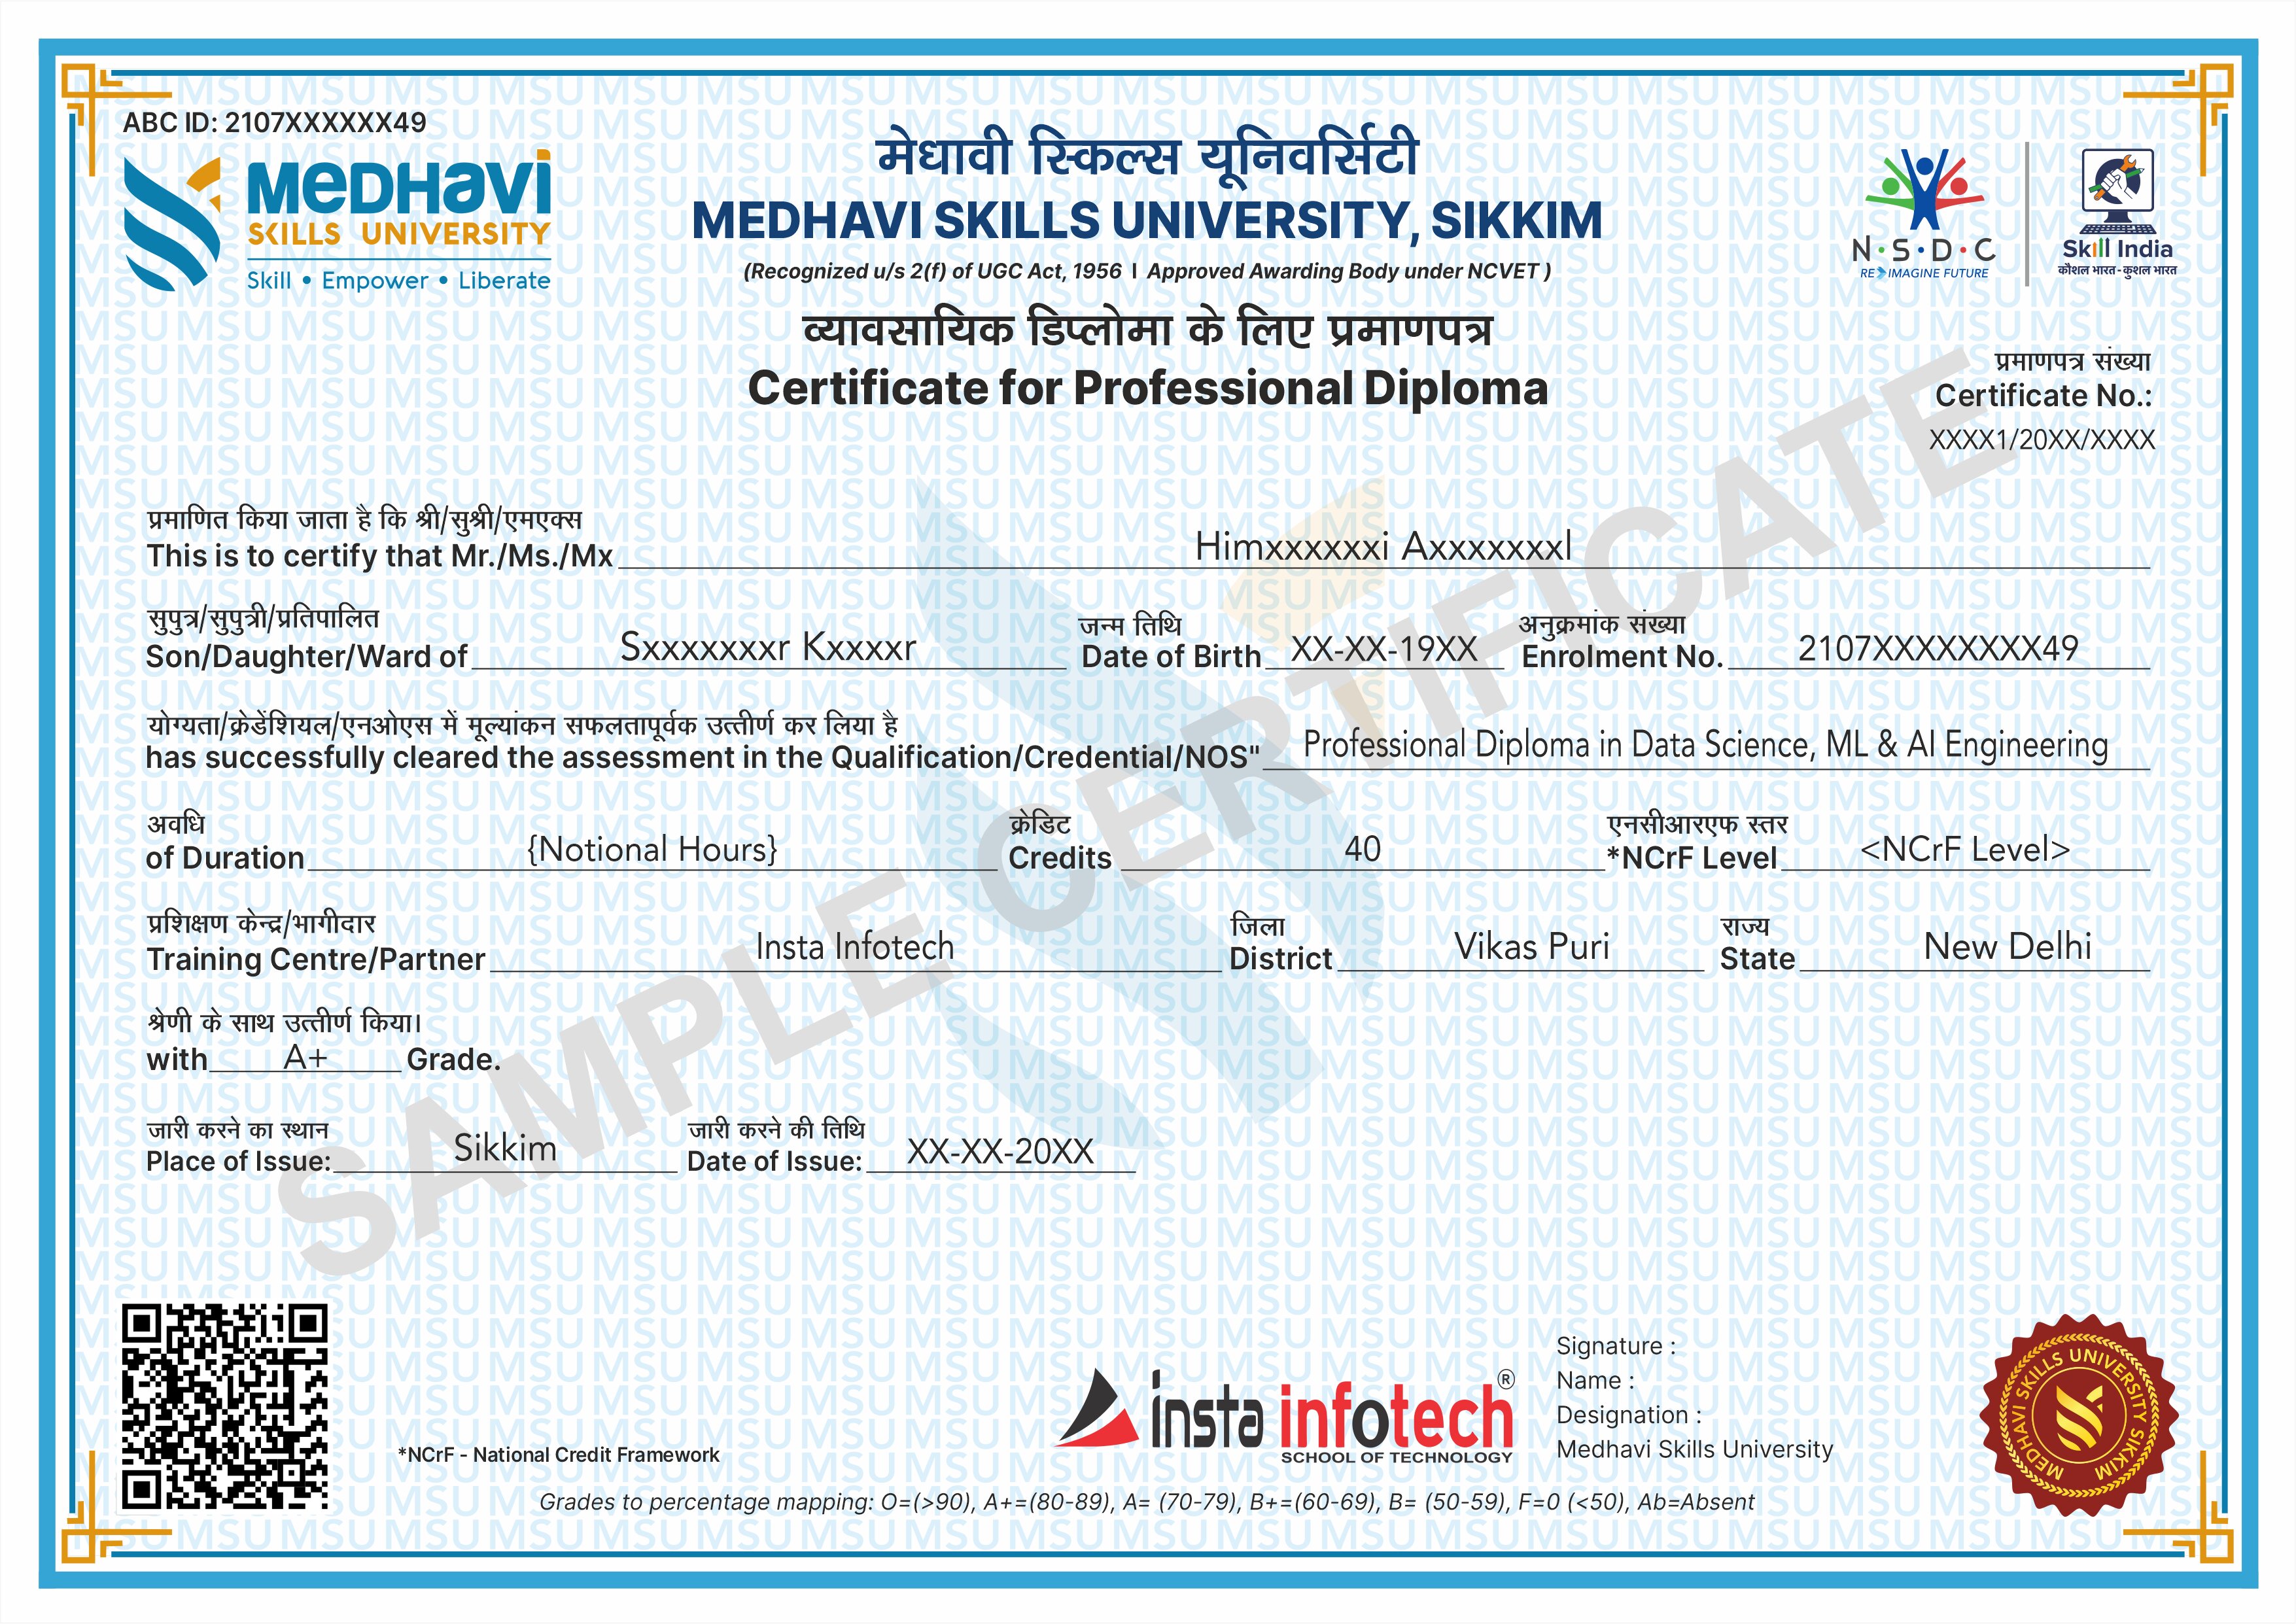
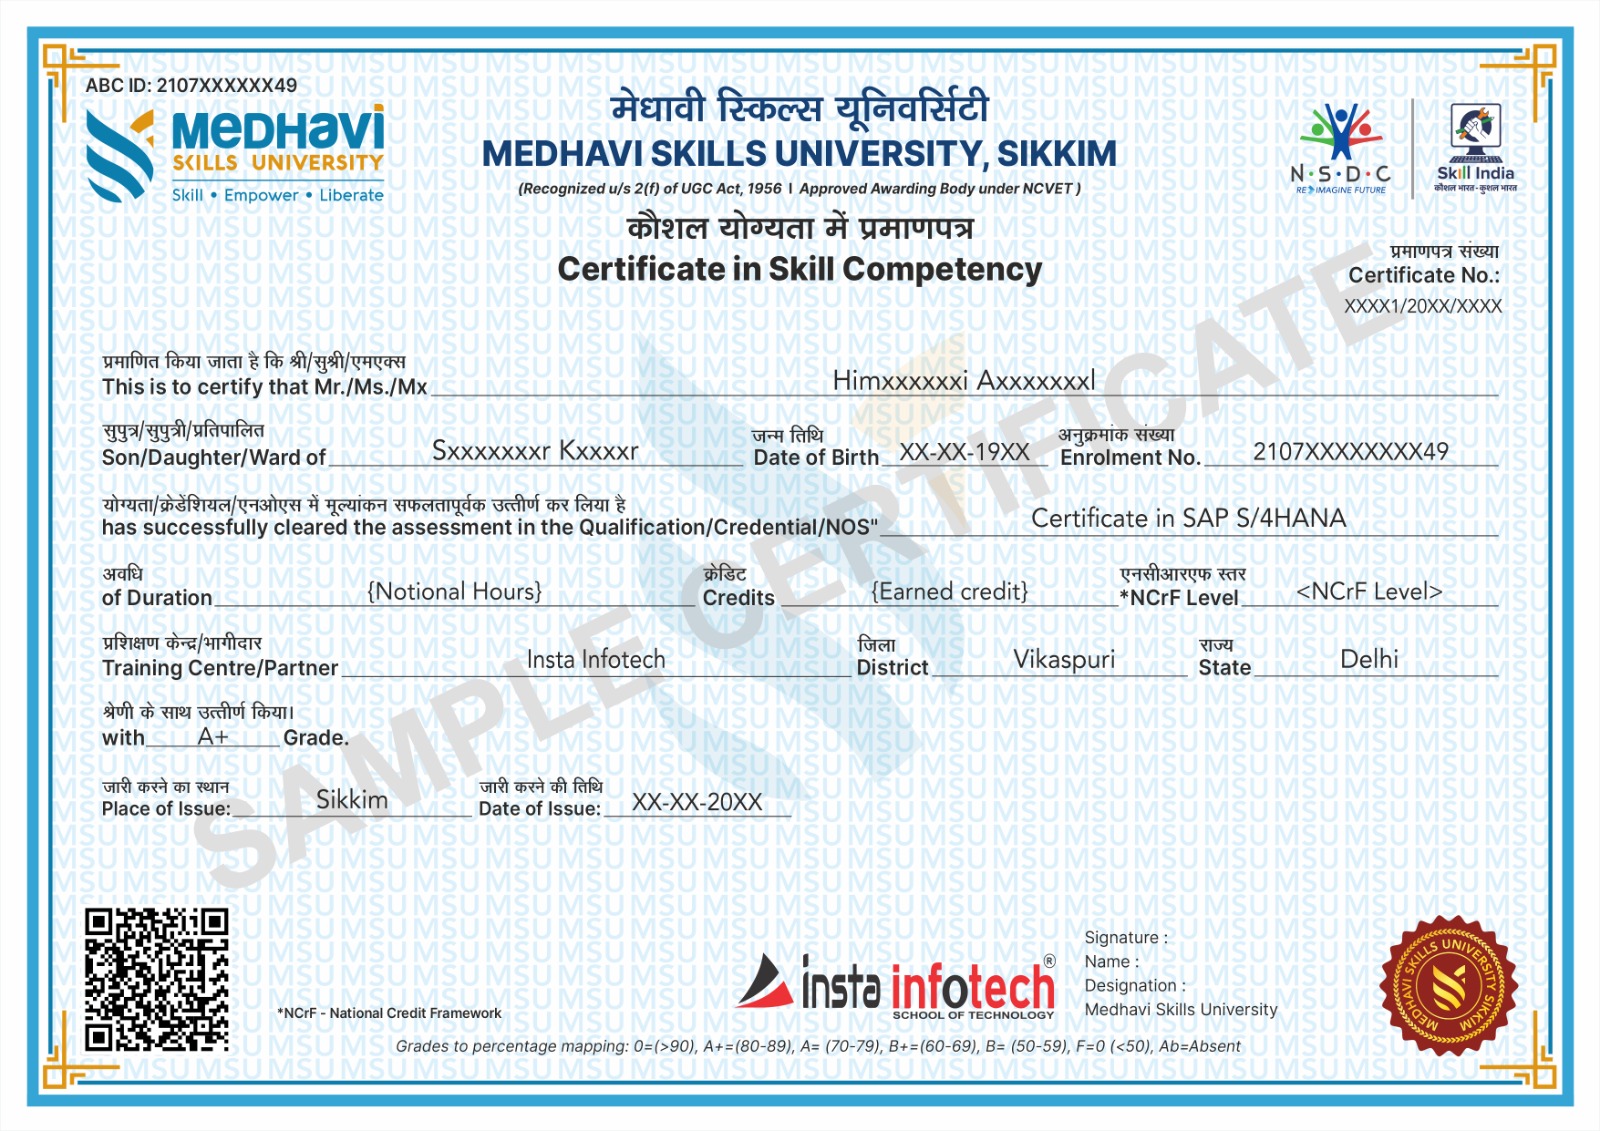
Eligible programs offer a university-recognised Skills Certificate or Diploma delivered in partnership with Medhavi Skills University. These programs also provide NCrF (National Credit Framework) credits, which can contribute toward higher education pathways while strengthening the credibility of your professional qualifications.